 Iris 1.10
Iris 1.10
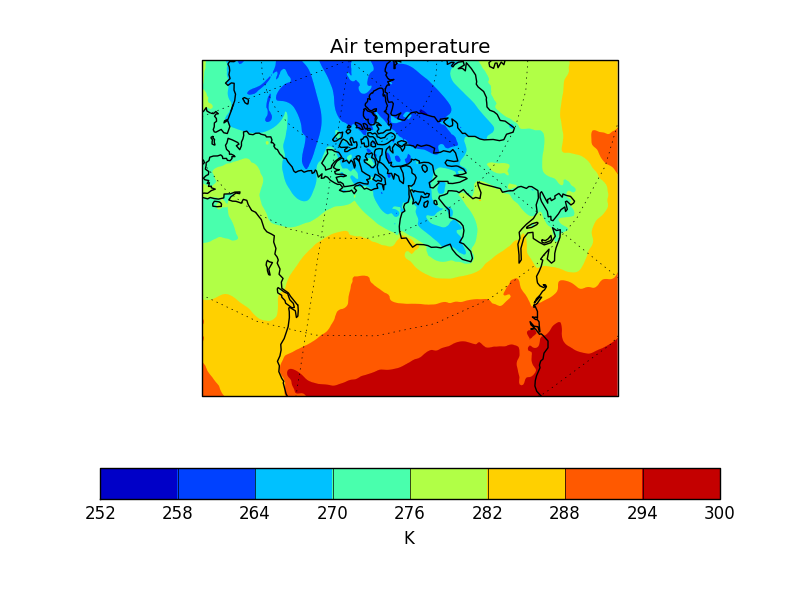
Demonstrates plotting data that are defined on a polar stereographic projection.
"""
Example of a polar stereographic plot
=====================================

Demonstrates plotting data that are defined on a polar stereographic
projection.

"""

import matplotlib.pyplot as plt

import iris
import iris.plot as iplt
import iris.quickplot as qplt


def main():
    file_path = iris.sample_data_path('polar_stereo.grib2')
    cube = iris.load_cube(file_path)
    qplt.contourf(cube)
    ax = plt.gca()
    ax.coastlines()
    ax.gridlines()
    iplt.show()


if __name__ == '__main__':
    main()
(Source code, png)
