 Iris 1.10
Iris 1.10
"""
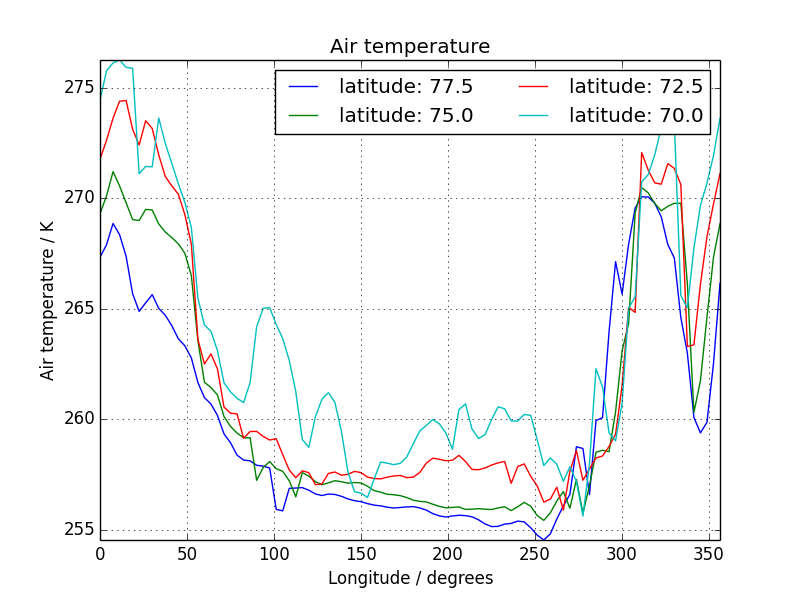
Multi-line temperature profile plot
^^^^^^^^^^^^^^^^^^^^^^^^^^^^^^^^^^^
"""
import matplotlib.pyplot as plt
import iris
import iris.plot as iplt
import iris.quickplot as qplt
def main():
fname = iris.sample_data_path('air_temp.pp')
# Load exactly one cube from the given file.
temperature = iris.load_cube(fname)
# We only want a small number of latitudes, so filter some out
# using "extract".
temperature = temperature.extract(
iris.Constraint(latitude=lambda cell: 68 <= cell < 78))
for cube in temperature.slices('longitude'):
# Create a string label to identify this cube (i.e. latitude: value).
cube_label = 'latitude: %s' % cube.coord('latitude').points[0]
# Plot the cube, and associate it with a label.
qplt.plot(cube, label=cube_label)
# Add the legend with 2 columns.
plt.legend(ncol=2)
# Put a grid on the plot.
plt.grid(True)
# Tell matplotlib not to extend the plot axes range to nicely
# rounded numbers.
plt.axis('tight')
# Finally, show it.
iplt.show()
if __name__ == '__main__':
main()
(Source code, png)
