 Iris 1.8
Iris 1.8
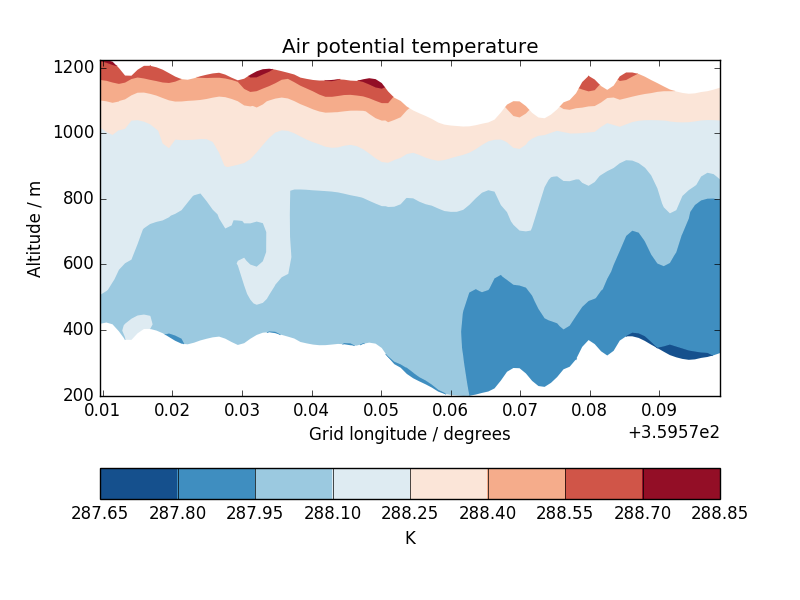
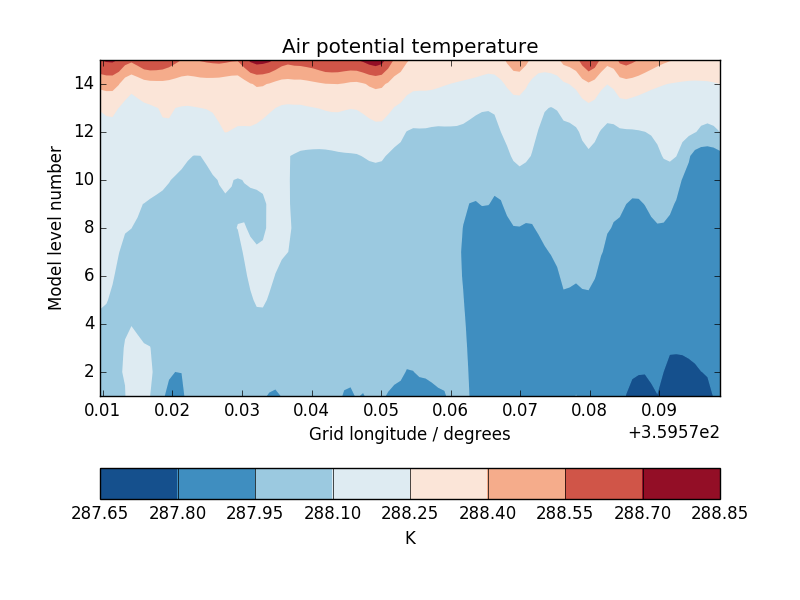
This example demonstrates contour plots of a cross-sectioned multi-dimensional cube which features a hybrid height vertical coordinate system.
"""
Cross section plots
===================

This example demonstrates contour plots of a cross-sectioned multi-dimensional cube which features
a hybrid height vertical coordinate system.

"""

import matplotlib.pyplot as plt

import iris
import iris.plot as iplt
import iris.quickplot as qplt


def main():
    fname = iris.sample_data_path('hybrid_height.nc')
    theta = iris.load_cube(fname)

    # Extract a single height vs longitude cross-section. N.B. This could easily be changed to
    # extract a specific slice, or even to loop over *all* cross section slices.
    cross_section = next(theta.slices(['grid_longitude', 'model_level_number']))

    qplt.contourf(cross_section, coords=['grid_longitude', 'altitude'],
                  cmap='RdBu_r')
    iplt.show()

    # Now do the equivalent plot, only against model level
    plt.figure()

    qplt.contourf(cross_section, coords=['grid_longitude', 'model_level_number'],
                  cmap='RdBu_r')
    iplt.show()


if __name__ == '__main__':
    main()

(png)

(png)