 Iris 1.7
Iris 1.7
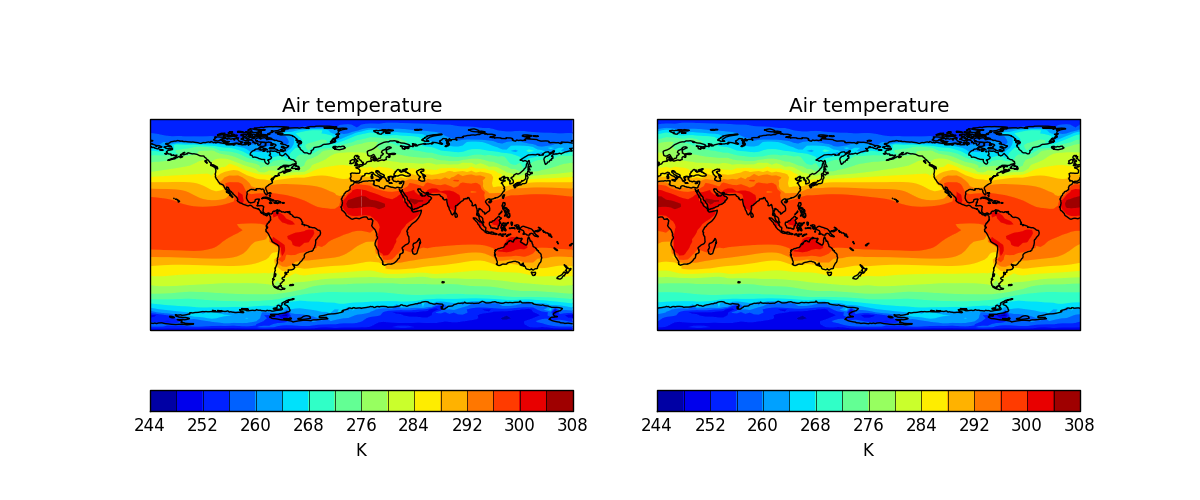
This example demonstrates a contour plot of global air temperature. The plot title and the labels for the axes are automatically derived from the metadata.
"""
Quickplot of a 2d cube on a map
===============================

This example demonstrates a contour plot of global air temperature.
The plot title and the labels for the axes are automatically derived from the metadata.

"""
import cartopy.crs as ccrs
import matplotlib.pyplot as plt

import iris
import iris.quickplot as qplt


def main():
    fname = iris.sample_data_path('air_temp.pp')
    temperature = iris.load_cube(fname)

    # Plot #1: contourf with axes longitude from -180 to 180
    fig = plt.figure(figsize=(12, 5))
    plt.subplot(121)
    qplt.contourf(temperature, 15)
    plt.gca().coastlines()

    # Plot #2: contourf with axes longitude from 0 to 360
    proj = ccrs.PlateCarree(central_longitude=-180.0)
    ax = plt.subplot(122, projection=proj)
    qplt.contourf(temperature, 15)
    plt.gca().coastlines()
    plt.show()

if __name__ == '__main__':
    main()