 Iris 1.2
Iris 1.2
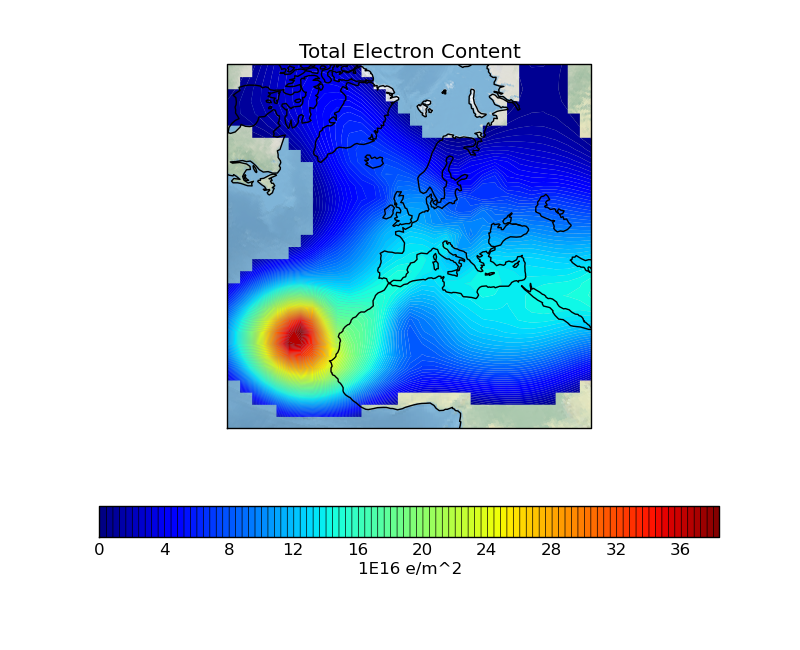
This space weather example plots a filled contour of rotated pole point data with a shaded relief image underlay. The plot shows aggregated vertical electron content in the ionosphere.
The plot exhibits an interesting outline effect due to excluding data values below a certain threshold.
"""
Ionosphere space weather
========================

This space weather example plots a filled contour of rotated pole point data with a shaded relief image underlay.
The plot shows aggregated vertical electron content in the ionosphere.

The plot exhibits an interesting outline effect due to excluding data values below a certain threshold.

"""

import matplotlib.pyplot as plt
import numpy.ma as ma

import iris
import iris.plot as iplt
import iris.quickplot as qplt


def total_electron_content_filter(cube, field, filename):
    # Filter out all cubes that don't have a matching 'long_name' attribute.
    if hasattr(field, 'long_name') and field.long_name != 'total electron content':
        raise iris.exceptions.IgnoreCubeException()


def main():
    # Load the "total electron content" cube.
    filename = iris.sample_data_path('space_weather.nc')
    cube = iris.load_cube(filename, 'total electron content')

    # Explicitly mask negative electron content.
    cube.data = ma.masked_less(cube.data, 0)

    # Currently require to remove the multi-dimensional
    # latitude and longitude coordinates for Iris plotting.
    cube.remove_coord('latitude')
    cube.remove_coord('longitude')

    # Plot the cube using one hundred colour levels.
    qplt.contourf(cube, 100)
    plt.title('Total Electron Content')
    plt.xlabel('longitude / degrees')
    plt.ylabel('latitude / degrees')
    plt.gca().stock_img()
    plt.gca().coastlines()
    plt.show()


if __name__ == '__main__':
    main()