 Iris 1.10
Iris 1.10
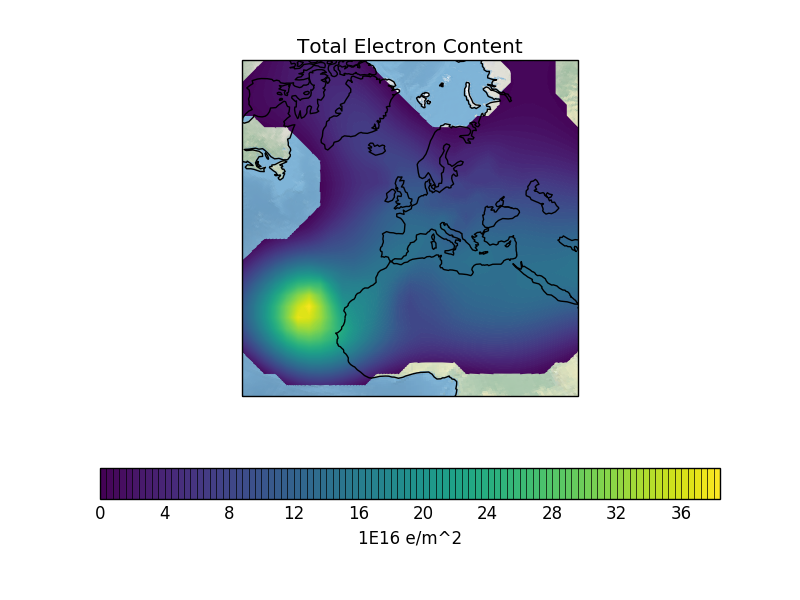
This space weather example plots a filled contour of rotated pole point data with a shaded relief image underlay. The plot shows aggregated vertical electron content in the ionosphere.
The plot exhibits an interesting outline effect due to excluding data values below a certain threshold.
"""
Ionosphere space weather
========================

This space weather example plots a filled contour of rotated pole point
data with a shaded relief image underlay. The plot shows aggregated
vertical electron content in the ionosphere.

The plot exhibits an interesting outline effect due to excluding data
values below a certain threshold.

"""

import matplotlib.pyplot as plt
import numpy.ma as ma

import iris
import iris.plot as iplt
import iris.quickplot as qplt


def main():
    # Enable a future option, to ensure that the netcdf load works the same way
    # as in future Iris versions.
    iris.FUTURE.netcdf_promote = True

    # Load the "total electron content" cube.
    filename = iris.sample_data_path('space_weather.nc')
    cube = iris.load_cube(filename, 'total electron content')

    # Explicitly mask negative electron content.
    cube.data = ma.masked_less(cube.data, 0)

    # Plot the cube using one hundred colour levels.
    qplt.contourf(cube, 100)
    plt.title('Total Electron Content')
    plt.xlabel('longitude / degrees')
    plt.ylabel('latitude / degrees')
    plt.gca().stock_img()
    plt.gca().coastlines()
    iplt.show()


if __name__ == '__main__':
    main()
(Source code, png)
