 Iris 1.10
Iris 1.10
This example shows how to define and use a custom iris.analysis.Aggregator, that provides a new statistical operator for use with cube aggregation functions such as collapsed(), aggregated_by() or rolling_window().
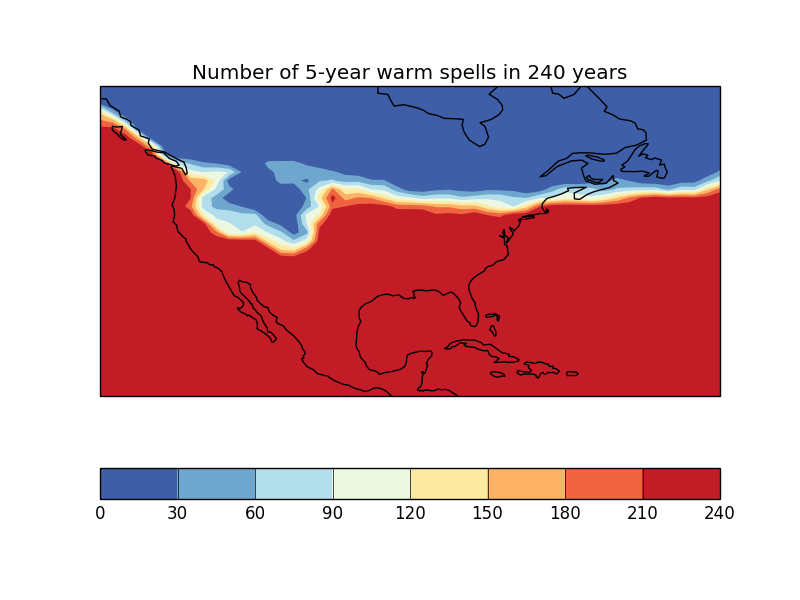
In this case, we have a 240-year sequence of yearly average surface temperature over North America, and we want to calculate in how many years these exceed a certain temperature over a spell of 5 years or more.
"""
Calculating a custom statistic
==============================

This example shows how to define and use a custom
:class:`iris.analysis.Aggregator`, that provides a new statistical operator for
use with cube aggregation functions such as :meth:`~iris.cube.Cube.collapsed`,
:meth:`~iris.cube.Cube.aggregated_by` or
:meth:`~iris.cube.Cube.rolling_window`.

In this case, we have a 240-year sequence of yearly average surface temperature
over North America, and we want to calculate in how many years these exceed a
certain temperature over a spell of 5 years or more.

"""
import matplotlib.pyplot as plt
import numpy as np

import iris
from iris.analysis import Aggregator
import iris.plot as iplt
import iris.quickplot as qplt
from iris.util import rolling_window


# Define a function to perform the custom statistical operation.
# Note: in order to meet the requirements of iris.analysis.Aggregator, it must
# do the calculation over an arbitrary (given) data axis.
def count_spells(data, threshold, axis, spell_length):
    """
    Function to calculate the number of points in a sequence where the value
    has exceeded a threshold value for at least a certain number of timepoints.

    Generalised to operate on multiple time sequences arranged on a specific
    axis of a multidimensional array.

    Args:

    * data (array):
        raw data to be compared with value threshold.

    * threshold (float):
        threshold point for 'significant' datapoints.

    * axis (int):
        number of the array dimension mapping the time sequences.
        (Can also be negative, e.g. '-1' means last dimension)

    * spell_length (int):
        number of consecutive times at which value > threshold to "count".

    """
    if axis < 0:
        # just cope with negative axis numbers
        axis += data.ndim
    # Threshold the data to find the 'significant' points.
    data_hits = data > threshold
    # Make an array with data values "windowed" along the time axis.
    hit_windows = rolling_window(data_hits, window=spell_length, axis=axis)
    # Find the windows "full of True-s" (along the added 'window axis').
    full_windows = np.all(hit_windows, axis=axis+1)
    # Count points fulfilling the condition (along the time axis).
    spell_point_counts = np.sum(full_windows, axis=axis, dtype=int)
    return spell_point_counts


def main():
    # Enable a future option, to ensure that the netcdf load works the same way
    # as in future Iris versions.
    iris.FUTURE.netcdf_promote = True

    # Load the whole time-sequence as a single cube.
    file_path = iris.sample_data_path('E1_north_america.nc')
    cube = iris.load_cube(file_path)

    # Make an aggregator from the user function.
    SPELL_COUNT = Aggregator('spell_count',
                             count_spells,
                             units_func=lambda units: 1)

    # Define the parameters of the test.
    threshold_temperature = 280.0
    spell_years = 5

    # Calculate the statistic.
    warm_periods = cube.collapsed('time', SPELL_COUNT,
                                  threshold=threshold_temperature,
                                  spell_length=spell_years)
    warm_periods.rename('Number of 5-year warm spells in 240 years')

    # Plot the results.
    qplt.contourf(warm_periods, cmap='RdYlBu_r')
    plt.gca().coastlines()
    iplt.show()


if __name__ == '__main__':
    main()
(Source code, png)